
Page 6 - Demo
P. 6
6|OctOber 2020 Slippery rOck Gazette
Training & Education
• •
• •
• • •
Producing quality products? Delivering excellent customer service?
Providing short process times? Maintaining a pleasant work environment for your people? Sales growth every year? Lower costs?
Survival?
The Goal
A Process of Ongoing Improvement
measure. If your income exceeds your expenses, you made money. Earnings before interest, tax, depreciation and amortization (EBITDA) is a common mea- sure of a company’s operating performance.
• Return on Sales (ROS)
is a relative measure. Making $100,000 on ten million in annual sales is only a 1% ROS. Not very good. In fact, a privately owned company should expect at least a 10% ROS every year.
• Cash Flow is a survival mea- sure. If you have enough cash flow, it may not be an important metric. If you don’t have enough cash flow, it is the only important metric.
Throughput (expressed as $T) is the rate at which a company earns money through sales. It is the measure of value added. A company buys raw materials, transforms them into finished products and sells them to their customers. Throughput is the measure of value added due to the transformation of raw materials into finished products. The for- mula for Throughput calculation is:
Throughput = Sales – Truly Variable Expenses
Truly variable expenses (ex- pressed as TVE) are those outflows of cash associated di- rectly with a specific product or job. They are “variable” in that changes in TVE are directly asso- ciated with changes in sales.
Typical variable expenses are:
• Raw materials
• Transportation costs for the raw materials
• Outsourcing (farming out manu- facturing to another company)
• Sales commissions (paid per
sale, not per time period)
If all four were active, the for-
mula for $T would be:
Throughput = Sales – (raw ma- terials + freight + outsourcing + commissions)
The continuing objective should be that Throughput is always trend- ing up.
$T Scheduling
Rather than using square feet, which is often not reflective of actual labor content (see The Art of Scheduling in the February 2019 edition of SRG), we use $T as the primary metric for schedul- ing. Daily “buckets” are filled to a predetermined amount to meet the market demand and to achieve the financial goals of the company.
Your vehicle runs best with the proper mixture of gasoline (fuel) and air (oxygen). If that mixture is not correct, the engine will not run well, if at all. Scheduling is much the same. A good schedule requires the proper mix of volume (how much) and velocity (how fast). The volume should be “Level Loaded” using $T to assure the labor con- tent is about the same day to day. A level load by itself will increase business productivity. The velocity, or time allowed, must be controlled too. A desirable and common pro- cess time for the countertop in- dustry is one week from template through install. Template Monday; install the following Monday. A good schedule will allow the same process time for all jobs. In fact, scheduling jobs with different pro- cess times will cause manufactur- ing disruptions and chaos. The best schedule is one that is level loaded and all jobs planned to flow at the same pace.
$T Tracking
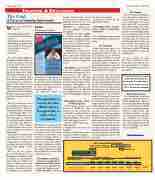
The best business performance is one that creates a plan for ac- tion in advance of each month. You should know how much value added ($T) you need per day in order to make a given level of profit. You should set up these goals for your scheduling depart- ment to load that amount of $T for each product line each day of the month. And, you will need to track this performance plan every day to assure that the goals can be met at the end of the month. Chart One is a daily $T Tracking Report indicating the status to the monthly goals.
In this example, the daily $T Goal is $23,500 with a Productivity Score Goal of 1.25. The current score is 1.33 which is $67,509 ahead of the goal so far,
MISSING
Buffer Management
The fundamental behavioral change in Synchronous Flow is Buffer Management. The pur- pose of the daily Buffer Meeting is to identify and record buffer status issues and assign respon- sibility to address them. The meetings are held once per day at a designated time and place for a maximum of 15 minutes. Everyone is expected to be on time and prepared to discuss the status of the Buffers for which each is responsible.
Please turn to page 7
What is the goal of your company?
Ed Hill
Synchronous Solutions
generation of wealth) and not on the reduction of costs. That is not to say that good stewardship of resources is ignored. It’s just that the focus is on generating reve- nue, not cutting costs.
An important aspect of
The fact is, your company is in business to make money. If you were excellent at every item in the list above, but you were not profitable, you would go out of business. Your business should be organized to “make more money now and in the fu- ture.” Earn a reasonable profit in the present conditions and set your company up to make more money in the future. It is all about continuous improvement. This is the message in The Goal, a book written by Dr. Eliyahu Goldratt, which in my opinion is one of best business books ever published.
The Goal is written as a novel and explains the business ap- proach called The Theory of Constraints (TOC), now known as Synchronous Flow. It is the story of application of the TOC principles to transform an underperforming company to an excellent one. Moreover, it is the story of how continu- ous improvement can be a sys- tematic approach to business management.
If you haven’t read this book, I encourage you to do so. If you haven’t read it recently, I en- courage you to read it again. It is available from any book seller in hard copy, digital or audio formats.
One of the key princi- ples of Synchronous Flow is Throughput Accounting, which is a simple, yet extraordinary, way to look at a company’s fi- nances. It focuses on revenue generation, not product costing. As such, it focuses on the posi- tive potential of a company (the
that month.
MARKET BUFFER
Throughput Accounting is that the metrics are derived using the same data as in the existing cost accounting system. This means that there is no investment in ad- ditional accounting software or resources. No additional entries have to be made. The numbers are simply calculated in a differ- ent way and presented in a dif- ferent report format. The bottom line is always the same in either accounting system.
Throughput Accounting
focuses on creating more profit now and in the future
There are three important met- rics regarding “making money.”
• Net Profit (NP) is an absolute
Productivity Score isINvFaOlue BUFFER
added ($T) divided by all the money it took to do so.
PRODUCTIVITY SCORE = $S ÷ $OE $OE = All labor & overhead
TEMP BUF
The opportunity to increase $T (value added) is infinite. The opportunity to reduce costs is very limited.
Your Countertop Company
THROUGHPUT TRACKING
Today is: 9-23-2020
THROUGHPUT TRACKING
Week 3 Goal: $21,000 per Day
September 2020
Hard Surface $T Goal
$21,000
Total Throughput Goal
$23,000
Sample Countertop Co
Hard Surface Goal
Company Total T Earned
21
Fri 8/22
23,455
23,455
Production Days
WEEK OF Sept.14, 2020
Company Productivity Score
1.28
1.35
1.28
1.24
1.25
1.28
1.33
$T
Mon 8/1
24,018
24,018
Tues 8/18
25,343
25,343
Wed 8/20
23,987
23,987
Thurs 8/21
23,287
23,287
WTD
120,090
Total WTD
120,090
MTD
316,316
Total MTD
316,316
1.25
Total to Goal
67,509
F
{
